
India exports 2023 merchandise exports in December 2023 registered 0.96% growth at USD 38.45 Billion over USD 38.08 Billion in December 2022.
Major contributors to export growth in December 2023 include Engineering Goods, Iron Ore, Gems & Jewellery, Electronic Goods and Drugs & Pharmaceuticals.
Engineering Goods exports in December 2023 record an increase of 10.19 percent at USD 10.04 Billion over USD 9.11 Billion in December 2022. December 2023 record is the highest monthly export of engineering goods in the current financial year so far.
Gems and Jewellery exports in December 2023 improve by 14.07 percent at USD 2.90 Billion from USD 2.54 Billion in December 2022.
Electronic Goods exports registered an increase of 14.41 percent at USD 2.62 Billion in December over USD 2.29 Billion in December 2022. December 2023 record is the highest monthly export of electronics in the current financial year so far.
Drugs and Pharmaceutical Products in December 2023 at USD 2.47 Billion registered an increase of 9.30 percent over USD 2.27 Billion in December 2022. December 2023 record is the highest monthly export of Drugs and Pharmaceuticals Products in the current financial year so far.
Agricultural exports continue to grow in December 2023: Tobacco (38.94%), Meat, Dairy & Poultry Products (29.76%), Spices (27.68%), Fruits & Vegetables (25.36%), Cereal Preparations & Miscellaneous Processed Items (13.5%) and Oil Seeds (8.48%).
Overall trade deficit during April-December improves by 35.87 percent from USD 108.13 Billion in 2022 to USD 69.34 Billion in 2023; merchandise trade deficit also improves by 11.45 percent from USD 212.34 Billion in April-December 2022 to USD 188.02 Billion in April-December 2023.
Posted by prateekrathor954@gmail.com
• India’s overall exports (Merchandise and Services combined) in December 2023* is estimated to be USD 66.33 Billion, exhibiting a negative growth of (-) 4.25 per cent over December 2022. Overall imports in December 2023* is estimated to be USD 71.50 Billion, exhibiting a negative growth of (-) 7.18 per cent over December 2022.
Table 1: Trade during December 2023*
|
| December (USD | December (USD |
Merchandise | Exports | 38.45 | 38.08 |
Imports | 58.25 | 61.22 | |
Services* | Exports | 27.88 | 31.19 |
Imports | 13.25 | 15.81 | |
Overall Trade (Merchandise +Services) * | Exports | 66.33 | 69.28 |
Imports | 71.50 | 77.03 | |
Trade | -5.17 | -7.75 |
* Note: The latest data for services sector released by RBI is
for November 2023. The data for December 2023 is an estimation, which will be
revised based on RBI’s subsequent release. (ii) Data for April-December 2022
and April-September 2023 has been revised on pro-rata basis using quarterly
balance of payments data.
·
India’s
overall exports (Merchandise and Services combined) in April-December 2023* are
estimated to be USD 565.04 Billion, exhibiting a negative growth of (-) 1.87
per cent over April-December 2022. Overall imports in April-December 2023* are
estimated to be USD 634.39 Billion, exhibiting a negative growth of (-) 7.24
per cent over April-December 2022.
Table 2: Trade during April-December
2023*
·
|
| April-December (USD | April-December (USD |
Merchandise | Exports | 317.12 | 336.30 |
Imports | 505.15 | 548.64 | |
Services* | Exports | 247.92 | 239.50 |
Imports | 129.24 | 135.29 | |
Overall Trade (Merchandise+ Services)* | Exports | 565.04 | 575.79 |
Imports | 634.39 | 683.93 | |
Trade | -69.34 | -108.13 |
Fig 2: Overall Trade during
April-December 2023*
Fig 2: Overall Trade during
April-December 2023*
MERCHANDISE TRADE
· Merchandise exports in December 2023 were USD 38.45 Billion, as compared to USD 38.08
Billion in December 2022.
·
· Merchandise imports for the period April-December 2023 were USD 505.15 Billion as against USD 548.64 Billion during April-December 2022.
· The merchandise trade deficit for April-December 2023 was estimated at USD 188.02 Billion as against USD 212.34 Billion during April-December 2022.
· Merchandise exports for the period April-December 2023 were USD 317.12 Billion as against USD 336.30 Billion during April-December 2022.
- Non-petroleum
and non-gems & jewellery exports in December 2023 were USD 28.67
Billion, compared to USD 27.19 Billion in December 2022. - Non-petroleum, non-gems & jewellery (gold,
silver & precious metals) imports in December 2023 were USD 37.96
Billion, compared to USD 38.04 Billion in December 2022. Table 3: Trade excluding Petroleum and
Gems & Jewellery during December 2023December 2023
(USD
Billion)December
2022(USD
Billion)Non-
petroleum exports31.57
29.73
Non-
petroleum imports43.31
41.87
Non-petroleum
& Non Gems & Jewellery exports28.67
27.19
Non-petroleum
& Non Gems & Jewellery imports37.96
38.04
Note:
Gems & Jewellery Imports include Gold, Silver & Pearls, precious &
Semi-precious stonesFig 5: Trade excluding Petroleum and
Gems & Jewellery during December 2023- Non-petroleum
and non-gems & jewellery exports during April-December 2023 was USD
230.74 Billion, as compared to USD 233.73 Billion in April-December 2022. - Non-petroleum, non-gems & jewellery (gold,
silver & precious metals) imports were USD 320.75 Billion in
April-December 2023 as compared to USD 333 Billion in April-December 2022. - Table 4: Trade excluding Petroleum and Gems & Jewellery
April-December
2023(USD
Billion)April-December
2022(USD
Billion)Non-
petroleum exports255.05
262.72
Non-
petroleum imports376.53
390.01
Non-petroleum
& Non Gems & Jewellery exports230.74
233.73
Non-petroleum
& Non Gems & Jewellery imports320.75
333.00
Note: Gems & Jewellery Imports
include Gold, Silver & Pearls, precious & Semi-precious stonesFig 6: Trade excluding Petroleum and
Gems & Jewellery during April-December 2023- For the month of December 2023, under merchandise exports, 17 of the 30 key sectors exhibited positive growth in December 2023 as compared to same period last year (December 2022). These include Iron Ore (265.64%), Tobacco (38.94%), Meat, Dairy & Poultry Products (29.76%), Spices (27.68%), Fruits & Vegetables (25.36%), Electronic Goods (14.41%), Gems & Jewellery (14.07%), Cereal Preparations & Miscellaneous Processed Items (13.5%), Plastic & Linoleum (10.43%), Engineering Goods (10.19%), Handicrafts Excl. Hand Made Carpet (9.37%), Drugs & Pharmaceuticals (9.3%), Cotton Yarn/Fabs./Made-Ups, Handloom Products Etc. (8.62%), Oil Seeds (8.48%), Mica, Coal & Other Ores, Minerals Including Processed Minerals (5.17%), Carpet (3.82%) and Ceramic Products & Glassware (2.95%).
- Under merchandise imports, 15 out of 30 key sectors exhibited negative growth in December 2023. These include Sulphur & Unroasted Iron Pyrites (-67.97%), Transport Equipment (-55.11%), Vegetable Oil (-39.21%), Fertilisers, Crude & Manufactured (-36.37%), Project Goods (-30.8%), Pulp And Waste Paper (-28.86%), Newsprint (-23.65%), Petroleum, Crude & Products (-22.77%), Silver (-19.11%), Organic & Inorganic Chemicals (-15.58%), Chemical Material & Products (-14.37%), Textile Yarn Fabric, Made-Up Articles (-12.34%), Pearls, Precious & Semi-Precious Stones (-11.73%), Iron & Steel (-2.44%) and Dyeing/Tanning/Colouring Mtrls. (-2.42%),
- For April-December 2023, under merchandise exports, 14 of the 30 key sectors exhibited positive growth during April-December 2023 as compared to April-December 2022. These include Iron Ore (215.54%), Oil Meals (27.36%), Electronic Goods (22.24%), Ceramic Products & Glassware (18.75%), Fruits & Vegetables (16.29%), Tobacco (13.15%), Oil Seeds (9.4%), Meat, Dairy & Poultry Products (8.87%), Drugs & Pharmaceuticals (8.2%), Cereal Preparations & Miscellaneous Processed Items (7.07%), Cotton Yarn/Fabs./Made-Ups, Handloom Products Etc. (6.03%), Spices (5.83%), Coffee (4.25%) and Cashew (0.13%).
- Under merchandise imports, 16 of the 30 key sectors exhibited negative growth in April-December 2023 as compared to April-December 2022. These include Cotton Raw & Waste (-62.22%), Silver (-52.65%), Sulphur & Unroasted Iron Pyrts (-39.37%), Fertilisers, Crude & Manufactured (-36.35%), Vegetable Oil (-27.72%), Coal, Coke & Briquettes, Etc. (-27.72%), Pearls, Precious & Semi-Precious Stones (-25.92%), Organic & Inorganic Chemicals (-21.03%), Petroleum, Crude & Products (-18.93%), Textile Yarn Fabric, Made-Up Articles (-15.21%), Transport Equipment (-14.64%), Newsprint (-12.4%), Wood & Wood Products (-11.29%), Pulp And Waste Paper (-11.06%), Leather & Leather Products (-7.46%) and Artificial Resins, Plastic Materials, Etc. (-3.13%).
- Services exports is projected to grow positively at 3.52 percent during April-December 2023 over April-December 2022.
- India’s trade deficit has shown considerable improvement in April-December 2023. Overall trade deficit for April-December 2023* is estimated at USD 69.34 Billion as compared to the deficit of USD 108.13 Billion during April-December 2022, registering a decline of (-) 35.87 percent. The merchandise trade deficit during April-December 2023 is USD 188.02 Billion compared to USD 212.34 Billion during April-December 2022, registering a decline of (-) 11.45 percent.
- My Previous Posts
- Non-petroleum
What india exports the most
What India exports the most
• Definition and significance of India’s exports.
• Importance of exports to the Indian economy.
Types and Categories of Exports
• Classification based on industries (e.g., textiles, pharmaceuticals, IT).
• Overview of major export categories.
Top Exported Products
• Detailed analysis of the top 10 products exported by India.
• Insights into the demand and market for these products.
Key Export Markets
• Overview of India’s major export destinations.
• Analysis of trade relations with key countries.
Export Trends and Statistics
• Historical export data and trends.
• Forecast for future export trends.
Factors Affecting India’s Exports
• Economic, political, and environmental factors impacting exports.
• Strategies to overcome challenges.
Government Policies and Initiatives
• Overview of government policies supporting exports.
• Impact of initiatives such as ‘Make in India’ and ‘Export Promotion Schemes.’
Export Procedures and Regulations
• Step-by-step guide to export procedures in India.
• Overview of export regulations and compliance requirements.
Export Documentation
• Detailed list of documents required for exporting goods from India.
• Importance of accurate documentation.
Export Financing and Insurance
• Overview of financing options for exporters.
• Importance of export insurance for risk management.
Case Studies of Successful Exporters
• Real-life examples of Indian companies excelling in exports.
• Strategies and best practices adopted by successful exporters.
Expert Insights on India’s Export Sector
• Quotes and advice from industry experts.
• Future outlook and recommendations for exporters.
Conclusion
• Summary of India’s export landscape.
• Call to action for businesses to explore export opportunities.
India exports to United States


India Exports to United States of America
India Exports to United States: An In-Depth Analysis
Introduction
Definition of India’s exports to the United States.
Importance and relevance of this trade relationship.
Types and Categories of Exports
Breakdown of various export categories (e.g., textiles, machinery, chemicals).
Volume and Value of Exports
Statistical data on the volume and value of exports over the years.
Trends in Exports
Analysis of trends, including growth rates and fluctuations.
Trade Agreements and Policies
Overview of trade agreements and policies impacting exports.
Economic Impact
Discussion on how these exports contribute to India’s economy.
Cultural Influence
Examination of how exports reflect Indian culture.
Challenges and Solutions
Discussion on challenges faced and strategies to overcome them.
Future Outlook
Predictions for the future of India’s exports to the United States.
Conclusion
Summary of key points and a call to action for further research.
FAQ’s
What are the major products India exports to the United States?
India’s major exports to the United States include textiles, pharmaceuticals, machinery, and gems and jewelry.
How has the trade relationship between India and the United States evolved over time?
The trade relationship has grown significantly, with both countries benefiting from increased trade volumes and collaborations in various sectors.
Are there any trade barriers affecting India’s exports to the United States?
There have been occasional trade disputes and issues, but overall, the trade barriers have been relatively low compared to other countries.
What role do trade agreements play in facilitating India’s exports to the United States?
Trade agreements help streamline the trade process, reduce tariffs, and provide a framework for resolving trade-related issues between the two countries.
How do India’s exports to the United States impact its economy?
India’s exports to the United States contribute significantly to its economy by providing revenue, creating jobs, and fostering economic growth.
What are some of the future prospects for India’s exports to the United States?
The future looks promising, with opportunities for growth in existing export sectors and potential expansion into new markets.
what are the major exports of india

Major exports of India, includes petroleum products, diamonds, and jewellery.
Exports are vital for traders because they create jobs, raise living standards, and contribute considerably to the economy.
Most exported products from India include Petroleum products, gems and jewellery, textiles and garments, medicines, organic and inorganic chemicals, machinery and equipment, iron and steel, cars, dairy products, and tea are among India’s top ten exports.
India’s top export destinations include the United States, the UAE, the Netherlands, China, Bangladesh, Singapore, Brazil, the UK, Saudi Arabia, Indonesia, Germany, and Hong Kong.
Did you know what India exports the most? India’s top export includes Petroleum Products, Gems & Jewellery and Textiles and Garments etc.
Non-traditional markets such as Africa, Latin America, and Oceania are likely to expand, giving India possibilities to diversify its export portfolio.
Global export data includes information such as product description, quantity, price, and harmonized code of the product, and can be obtained from platforms like Eximpedia.
Why did India ban Rice Exports


Rice, scientifically called Oryza sativa, is usually associated with humid and wet climates, although not restricted to tropical zones. While some posit that rice is a descendant of wild grass from the eastern Himalayan regions, another school of thought is that rice originated in southern India, finding its way to northern India and subsequently to China, Korea, the Philippines, Japan, and Indonesia around 1000 BCE.[1] Paddy, the Malay word for “rice plant,”[2] is interchangeably used with rice, specifically to describe the fields used for growing rice. Despite taking centuries to spread around the world, rice is now a primary agricultural and economic product. Besides being a staple food crop, rice is used to make ready-to-eat products like puffed rice. Rice husk, straw, and bran serve as animal and poultry feed, while rice bran oil is used in the soap industry. Given the crop’s influence over diets, cultures, and economic lifestyles worldwide, the United Nations (UN) designated 2004 as the `International Year of Rice’.[3] Rice comprises the bulk of the diet for almost 3.5 billion people,[4] with Asia having the longest continued reliance on rice for its average daily calorie intake.[5] Although the grain is grown in over 100 countries, 90 percent of the production occurs in Asia.[6] As the global population grows, the demand for rice will rise, pressuring the global agricultural chain for increased production. The disruption of factor markets and suppressed global supply in the aftermath of COVID-19 and the Ukraine-Russia crisis, amid other geopolitical strife, has put excess pressure on the rice market.[7] However, global rice production is expected to improve by 1.3 percent in FY 2023-24 due to higher producer prices, softening fertiliser costs, and continued government subsidies.[8]
Rice is vital in meeting the Sustainable Development Goals (SDGs). While about 900 million economically weak people depend on rice as either consumers or producers in the global value chain, around 400 million are directly involved in rice production.[9] Increased productivity and lower prices benefit economically weaker consumers and play a significant role in economic growth via growth linkages. As the source of 70 percent of the calorie consumption for the most marginalised populations in Asia, [10] rice is a crucial component in mitigating global hunger by providing greater food security and increased nutritional benefits. Besides directly contributing to SDG-1 (ending poverty) and SDG-2 (zero hunger), rice and its production process have implicit effects on SDG-5 (gender equality), SDG-6 (clean water and sanitation), SDG-8 (decent work and economic growth), SDG-12 (responsible consumption and production), SDG-13 (climate action), and SDG-15 (life on land).[11] For instance, despite playing a significant role in the farming, processing, and marketing processes of rice, women still face significant barriers in access to resources such as information, technology, and primary inputs. Irrigated rice fields receive almost 35 percent of the global irrigated water,[12] highlighting the need for water-saving management technologies and sustainable cropping mechanisms in its production process. As water becomes scarce and temperatures rise, this also raises questions about the sustainability of the rice sector. As such, sustainable consumption and production practices must be incorporated into the industry. International cooperation is needed to realign the rice value chain into a more sustainable practice, mainly focusing on innovations and practical research in the field (invoking SDG-17—strengthening the means of implementation and revitalising the global partnership for sustainable development).
India’s rice economy is estimated to be worth US$51.58 billion as of 2024.[13] India is also the second-largest producer and the largest exporter of rice globally,[14],[15] contributing to 40 percent of the global trade in rice. This paper focuses on the Indian rice market and delves into its structure—its processes, agents, and institutions. Further, it assesses the ban imposed on the exports of non-basmati rice (economic quality rice used for daily consumption) in July 2023, a measure by the Indian government to ensure domestic price stability. It delves into the harmful effects of the export ban on the basmati (premium quality of rice) and non-basmati income divide. It presents a demand-supply theoretical framework to analyse the ban’s effects on Indian consumers and producers. Here, the water-intensive nature of basmati is highlighted to foreground the need for crop-substitution policies that can attenuate India’s looming water crisis. A second theoretical model attempts to address the issue of the high environmental cost of rice production by promoting drier crops and leveraging the export ban. The paper also recommends promoting drier, climate-resilient millets to ensure nutritional security at a lower social price.
Which state exports the most beef in India
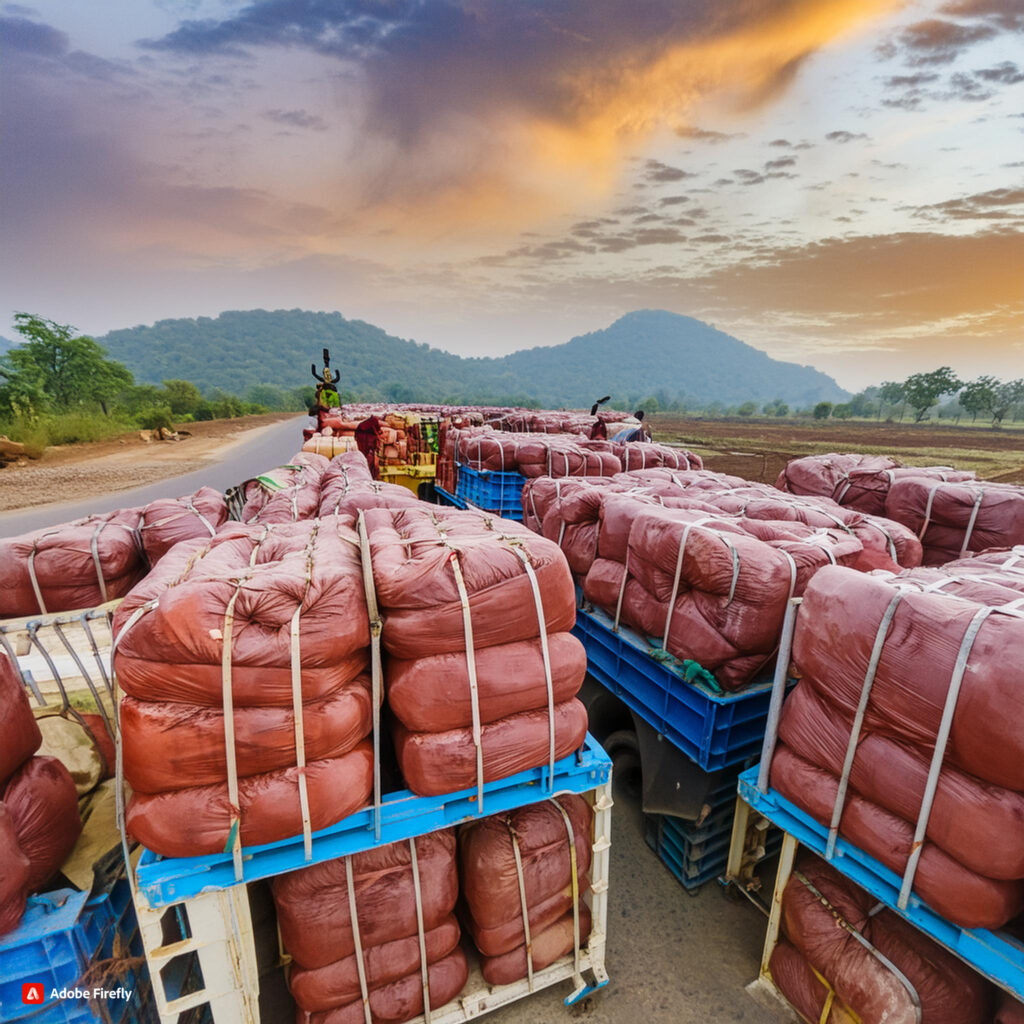
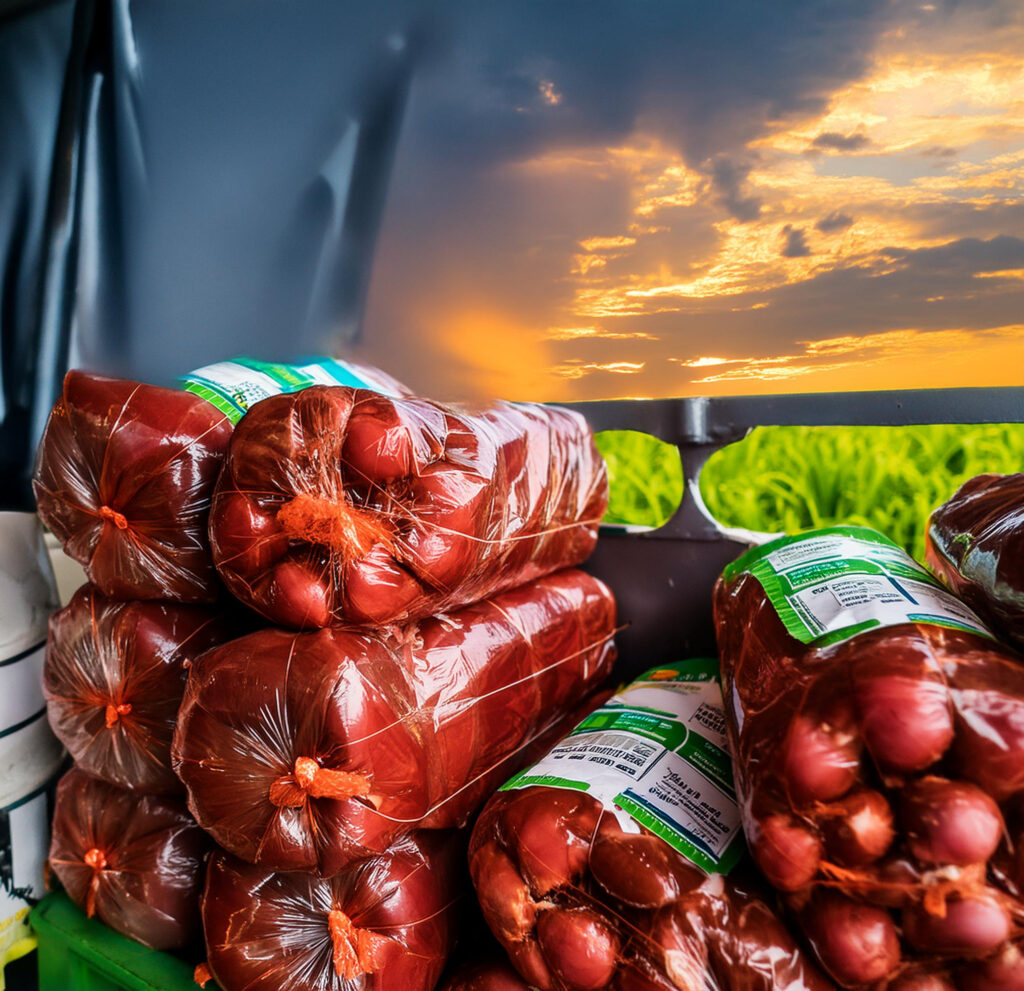
Meat denotes the consumption of an organism’s muscles or organs. India exports a substantial quantity of red meat in a nation wherein people respect cows. According to the United States Department of Agriculture, India was the global largest beef exporter in 2015, surpassing more recognised exporters such as Brazil and Australia.
This is because India sends a lot of water buffalo meat, a Bovidae family member classed as red meat (beef), by the United States Department of Agriculture. The buffalo industry has been quickly expanding, and it currently generates more export revenue for India than basmati rice.
Buffalo meat from India, a chewy crust and less expensive substitute for beef is consumed mainly in the Middle East and Asia, where increasing richness fuels animal protein consumption requirements. According to the country’s meat export policy, bone-in beef is illegal in India, and meat with bones is likewise forbidden, and India cannot ship it. Only meat without bone, such as buffalo, goat, and sheep meat, is allowed to be exported.
India exports predominantly raw, deboned portions of buffalo meat used in the processing industry. Only a small % of people make it to their homes for personal consumption, which is due to carabeef’s toughness. After reading this article, you will have a thorough understanding of the meat exporters in India and will be able to analyse the terminologies associated with the beef export company.
Kinds of Meat
- Red Meat
This comes from mammals and their tissue. It includes more iron-rich protein myoglobin than white meat. Here are several examples:
- Goat
- Cattle
- Pork
- Lamb
- White meat
It comes from poultry and small birds and is milder than red meat. Here are several examples:
- Turkey
- Goose
- Chicken
- Duck
What Nutrients Do You Find in Meat?
We believe lean meat is an excellent source of protein. After cooking, it contains roughly 25–30% protein by weight. Cooked chicken breast has about 31 grams of protein per 3.5-ounce (100-gram) meal. A plate of lean beef comprises around 27 grams.
Many people consider animal protein a total protein because it contains all nine necessary amino acids.
https://en.wikipedia.org/wiki/Main_Page
What Effects Does Meat Have on the Human Body?
Many experts have linked meat consumption to an increased risk of diabetes, heart disease and some malignancies. Red meat consumption also increases the risk of death, according to studies.
Meat is not only a great source of protein and amino acids, but it’s also the only way to get harmful cholesterol. Some meats have a lot of fat, particularly saturated fat. Consumers can raise the high cholesterol concentration in the body by consuming a saturated fat diet, and maintaining high cholesterol increases your risk of a heart attack.
Also Read: List of the Most Rewarding Export Products in India
Why is India the World’s Fourth-Largest Exporter of Beef?
India produced 3,760,000 tonnes of cattle and buffalo meat in 2020. India’s beef and bovine meat production climbed from 179,000 tonnes in 1971 to 3,760,000 tonnes in 2020, a 9.62% annual growth rate.
In the nineteenth century, 75% of Indians were vegetarians; however, in the twenty-first century, 71% were non-vegetarians. Since the nineteenth century, the population has grown dramatically, as has the proportion of the population who consumes meat. As a result, India is one of the world’s biggest exporters of beef.
Top 5 Beef Exporting Companies of India
Allanasons Private Limited is the top exporter with exporting value of ₹2028 crores. At the same time, Al-hamd Food Products Pvt Ltd is a bit behind with a ₹400 crores export Valuation. Al-hamd is followed by Mirha Exports Pvt Ltd., MK Overseas Pvt Ltd., and HMA Agro Industries PVT Ltd., with exportation values of ₹300 crores and ₹295 crores, respectively.
Top 5 cities That Export the Most Amount of Beef
Mumbai leads all the cities in exporting, with 39.94% of total beef. While the nation’s capital New Delhi stands second with 24.93%, Aligarh, Ghaziabad, and Agra had 6.28%, 5.93%, and 4.68% beef export, respectively.
Which country exports the most from India
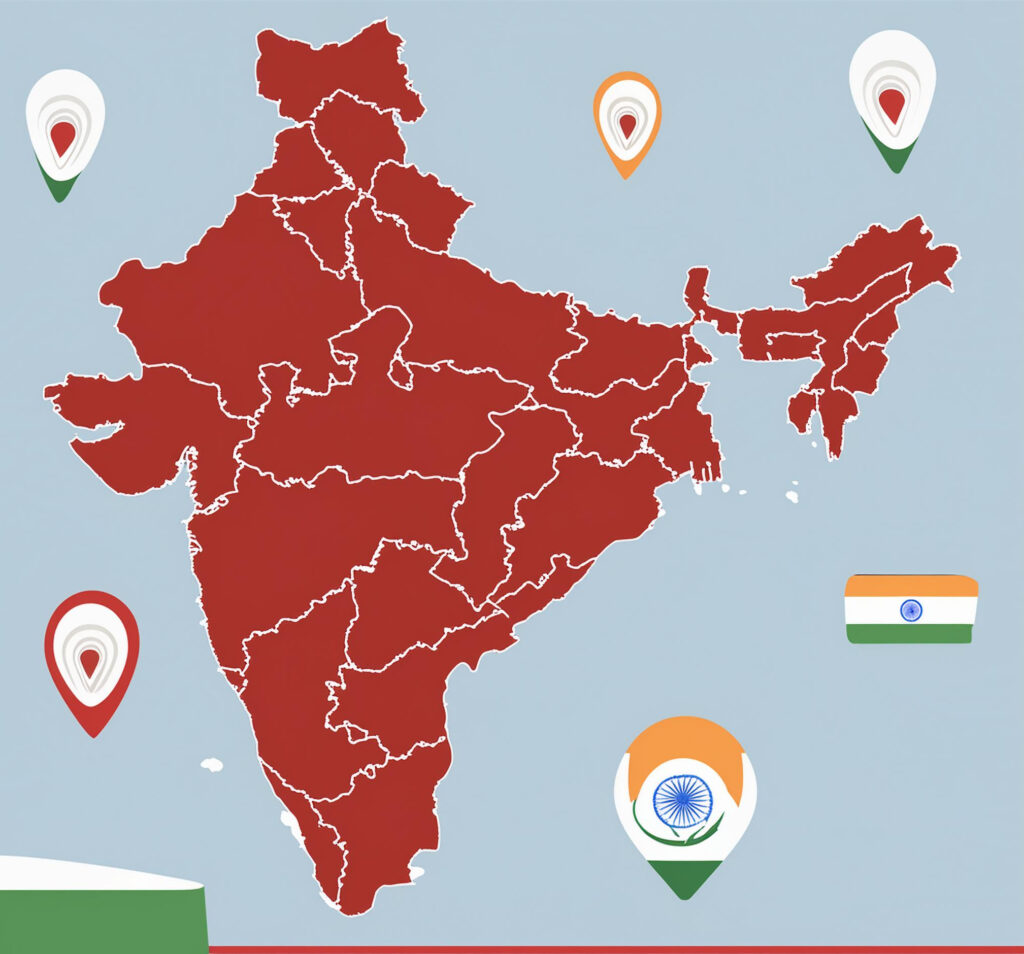
According to the Ministry of Commerce and Industry, the fifteen largest trading partners of India represent 61.67% of total trade by India in the financial year 2022–23.[1] These figures include trade in goods and commodities, but do not include services or foreign direct investment.
The two largest goods traded by India are mineral fuels (refined / unrefined) and gold (finished gold ware / gold metal). In the year 2013–14, mineral fuels (HS code 27) were the largest traded item with 181.383 billion US$ worth imports and 64.685 billion US$ worth re-exports after refining. In the year 2024–2025, gold and its finished items (HS code 71) were the second-largest traded items with 558.465 billion US$ worth imports and 41.692 billion US$ worth re-exports after value addition. These two goods are constituting 53% total imports, 34% total exports and nearly 100% of total trade deficit (136 billion US$) of India in the financial year 2013–14.[2] The services trade (exports and imports) are not part of commodities trade. The trade surplus in services trade is US$70 billion in the year 2017–18.[3]
Counting the European Union (EU) as one, the World Trade Organisation ranks India fifth for commercial services exports and sixth for commercial services imports.[4]
The two primary destinations of India’s exports are the EU and the United States, whereas the China and the EU are the two primary countries from which India’s imports come from.[1] These figures include trade in goods and commodities, but do not include services or foreign direct investment.
| Rank | Country | Exports | Imports | Total Trade | Trade Balance |
|---|---|---|---|---|---|
| – | 44.07 | 88.96 | 133.03 | -44.89 | |
| – | 73.67 | 57.83 | 131.50 | 15.84 | |
| 1 | 71.39 | 46.82 | 118.21 | 24.57 | |
| 2 | 13.60 | 90.72 | 104.32 | -77.12 | |
| 3 | 28.76 | 48.88 | 77.64 | -20.12 | |
| 4 | 9.69 | 38.62 | 48.32 | -28.93 | |
| 5 | 2.80 | 41.56 | 44.37 | -38.75 | |
| 6 | 9.06 | 26.89 | 35.95 | -17.83 | |
| 7 | 2.33 | 31.52 | 33.86 | -29.18 | |
| 8 | 11.00 | 21.70 | 32.70 | -10.70 | |
| 9 | 9.36 | 16.31 | 25.68 | -6.95 | |
| 10 | 6.10 | 19.26 | 25.35 | -13.16 | |
| 11 | 18.53 | 5.52 | 24.04 | 13.01 | |
| 12 | 6.49 | 17.50 | 23.97 | -11.00 | |
| 13 | 9.21 | 14.61 | 23.82 | -5.40 | |
| 14 | 4.99 | 14.78 | 19.77 | -9.79 | |
| 15 | 10.27 | 8.43 | 18.70 | 1.84 | |
| 16 | 6.63 | 11.68 | 18.31 | -5.05 | |
| 17 | 7.86 | 9.86 | 17.72 | -2.00 | |
| 18 | 1.82 | 15.50 | 17.31 | -13.68 | |
| 19 | 8.16 | 8.36 | 16.53 | -0.20 | |
| 20 | 9.19 | 6.28 | 15.46 | 2.92 | |
| 21 | 1.23 | 14.22 | 15.45 | -12.98 | |
| 22 | 5.22 | 10.10 | 15.31 | -4.88 | |
| 23 | 5.30 | 8.07 | 13.37 | -2.77 | |
| 24 | 7.81 | 5.07 | 12.88 | 2.75 | |
| 25 | 1.42 | 11.40 | 12.82 | -9.98 | |
| – | Remaining Countries | 140.82 | 112.51 | 253.32 | 28.31 |
| India’s Total | 409.06 | 656.13 | 1065.18 | -247.07 | |
Countries to which India is the largest trading partner[edit]
India is the primary export or import partner of several countries. The percentages on these tables are based on 2017 data as shown on the CIA World Factbook.
|
|


